Facts checked Article
Casino data literacy
How do I interpret UK gambling statistics reports when a new survey sets a new baseline?
To interpret a UK gambling statistics report, find the survey series and year first. The Gambling Survey for Great Britain began a new baseline in 2023, so its figures compare only with earlier GSGB years.
How do I interpret UK gambling statistics reports? Find the series first
How do I interpret UK gambling statistics reports? Start by finding which survey series a figure belongs to. Then find which year of that series it comes from.
The Gambling Survey for Great Britain (GSGB) is the Gambling Commission's current official survey. Its first year of official data collection began in July 2023, using a new method. The Commission calls its results a new baseline.
So a GSGB figure can be compared with earlier GSGB years. It should not be lined up with older survey figures as if they made one trend. This page shows why, and what you can say instead.
Sources: Gambling Commission: GSGB 2023 introduction; Gambling Commission: GSGB guidance.
The series in five figures
- Survey
- Gambling Survey for Great Britain, adults aged 18 and overGambling Commission: GSGB annual report 2025 · as checked on
- Official data collection began
- July 2023Gambling Commission: GSGB 2023 introduction · as checked on
- Baselines named in the guidance
- 2023 and 2024Gambling Commission: GSGB guidance · as checked on
- Adults taking part, 2025
- 20,775Gambling Commission: GSGB technical report · as checked on
- Latest annual report
- Published 16 July 2026, the third year of the new baselineGambling Commission: GSGB annual report 2025 · as checked on
Figures as published by the Gambling Commission, read on 23 September 2026.
A new baseline — the Commission's own words
The Commission states the rule in three places. Its 2023 annual report says its findings 'represent the first year of a new baseline against which future changes can be compared'. Its 2025 report calls that year 'the third year of a new baseline'.
Its guidance on using GSGB statistics is more specific. It lists trend work as a proper use, measuring change against the 2023 baseline and the 2024 baseline. It lists direct comparison with other gambling or health surveys as a use to avoid.
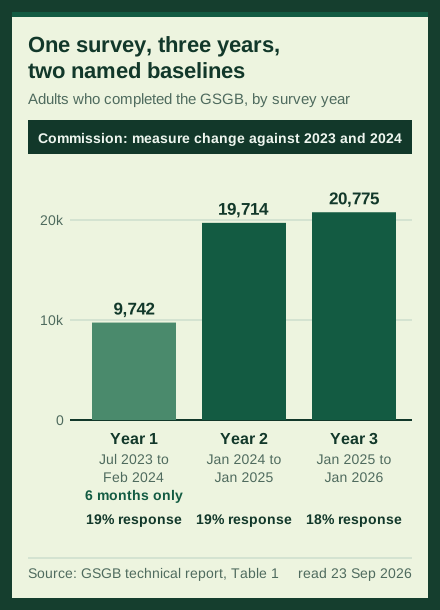
Two baselines are named because the first year was short. Year 1 ran from July 2023 to February 2024. From the second year, data collection moved to a calendar-year basis.
Sources: Gambling Commission: GSGB 2023 introduction; Gambling Commission: GSGB annual report 2025; Gambling Commission: GSGB guidance.
The rule, as the Commission writes it
Only comparisons with previous waves of the GSGB are appropriate when examining changes over time.
Why the older surveys sit on the other side of the line
Before the GSGB, the Commission measured gambling in several ways at once. The table below sets them beside the new survey. The Health Surveys were face-to-face surveys that carried gambling questions roughly every two years.
In December 2020 the Commission consulted on replacing them with one method. It published the results in June 2021. The new survey is push-to-web: letters invite people to answer online, and a paper questionnaire follows for those who do not.
The 2023 report is direct about the consequence. Its findings 'are not directly comparable' with the Health Surveys or the British Gambling Prevalence Survey series. The reason it gives is the different approach of the new method.
Sources: Gambling Commission: GSGB 2023 introduction.
Before and after the new baseline
| Source | When | How it asked | Evidence |
|---|---|---|---|
| British Gambling Prevalence Survey | 2007 and 2010 | A bespoke study of gambling | · Gambling Commission: GSGB 2023 introduction |
| Health Surveys for England, Scotland and Wales | Roughly every two years | Face-to-face health surveys with gambling questions | · Gambling Commission: GSGB 2023 introduction |
| Quarterly telephone survey | Quarterly, alongside the Health Surveys | By telephone | · Gambling Commission: GSGB 2023 introduction |
| Gambling Survey for Great Britain | From July 2023 | Push-to-web: online, then a paper questionnaire | · Gambling Commission: GSGB 2023 introduction |
Figures from the rows above the line and the row below it are not directly comparable.
9,742, then about 20,000 — three survey years side by side
The first GSGB year had 9,742 adults taking part. The next two had 19,714 and 20,775. The 2023 year held only six months of fieldwork, which is why it is smaller.
Response was lower than planned in every year. The technical report gives an address-level response rate of 19% in 2023 and 2024 and 18% in 2025, against a target of 22%. Boost samples were added in 2024 and 2025 to lift the number taking part.
A bigger sample narrows the margin of error. The guidance cites the larger samples from 2024 onwards as one reason the Commission removed some of its earlier caution in October 2025.
Sources: Gambling Commission: GSGB technical report; Gambling Commission: GSGB guidance.
Three GSGB years, same method
| Survey year | Fieldwork | Adults taking part | Response rate | Evidence |
|---|---|---|---|---|
| Year 1, 2023 | July 2023 to February 2024 | 9,742 | 19% | · Gambling Commission: GSGB technical report |
| Year 2, 2024 | January 2024 to January 2025 | 19,714 | 19% | · Gambling Commission: GSGB technical report |
| Year 3, 2025 | January 2025 to January 2026 | 20,775 | 18% | · Gambling Commission: GSGB technical report |
The target response rate was 22% in every year.
Mode — the design choice that moved the problem-gambling score
A new method can move a figure even when behaviour stays the same. The Commission tested this. It asked the London School of Economics and a team at NatCen to run an experiment on three design choices.
Mentioning gambling in the invitation letter raised the participation estimate, but not the estimate on the PGSI, a nine-question screen for problem gambling. A longer list of gambling activities had no detectable impact on the estimates.
The way people answered did matter. People who completed the survey online scored significantly higher on the PGSI than people answering by telephone. The Commission reads this as interview surveys under-reporting harm, because people soften answers when someone is asking.
Sources: Gambling Commission: GSGB guidance.
Words used on this page
- Baseline
- The first reading of a series, against which later readings from the same series are compared.
- PGSI
- The Problem Gambling Severity Index: nine questions, each scored from 0 to 3, added to a score from 0 to 27. A score of 8 or more is the band UK statistics call problem gambling.
- Push-to-web
- A survey design that invites people by letter to answer online, then offers a paper questionnaire.
- Wave
- One round of GSGB fieldwork. Four waves make one survey year.
- Confidence interval
- The range in which the true value probably falls, given that the figure comes from a sample.
- Base
- The group a percentage is taken from, such as all adults or people who gambled in the past year.
A survey year is a fieldwork window, not a calendar year
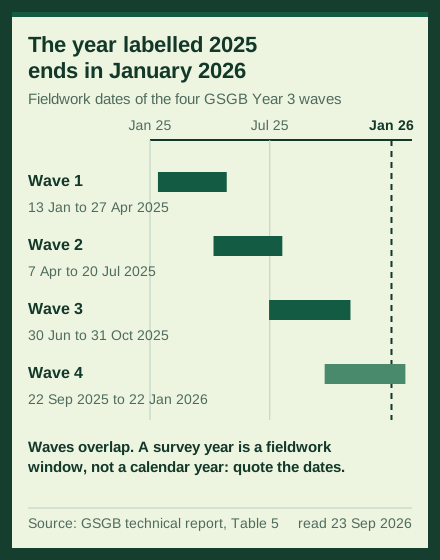
Each GSGB year is built from four waves of fieldwork. For the year labelled 2025, wave 1 began on 13 January 2025. Wave 4 closed on 22 January 2026.
The waves overlap, so a household reached in late 2025 may reply in January 2026. When you quote a GSGB figure, quote the year label and the fieldwork dates together.
The Commission also publishes each wave on its own. Its guidance says the annual data should be the default. Wave data suits questions about one period within a year, or questions asked only in some waves.
Sources: Gambling Commission: GSGB technical report; Gambling Commission: GSGB guidance.
Inside the series — 48% then 47%, and what that means
Within the GSGB, change can be measured. The Commission's trends report compares 2023 with 2025 for six key estimates. It found few differences in the gambling behaviours it examined.
Participation in the past four weeks was 48% in 2023 and 47% in 2025. The share with a PGSI score of 0 was 76.1% in 2023 and 76.9% in 2025. The report calls this a pattern of stability across most measures.
It did find some notable differences, listed below the table. None of them is a change in the overall rate.
These are population figures; they say nothing about any one reader. If gambling is causing harm to you or someone near you, GamCare is on 0808 8020 133, free, 24 hours.
Sources: Gambling Commission: GSGB trends 2023 to 2025.
2023 against 2025, inside the GSGB
| Estimate | 2023 | 2025 | Evidence |
|---|---|---|---|
| Gambled in the past four weeks | 48% | 47% | · Gambling Commission: GSGB trends 2023 to 2025 |
| PGSI score of 0 | 76.1% | 76.9% | · Gambling Commission: GSGB trends 2023 to 2025 |
This is the comparison the Commission allows. It shows stability, not a trend.
Notable differences between 2023 and 2025 in the trends report
- More male participants had gambled on activities other than lotteries in the past year
- More adults aged 35 to 54 had sought help for their own gambling
- Fewer female participants aged 55 and over had sought help because of someone else's gambling
Across surveys — what you can say instead of a trend
Suppose you have a GSGB figure and an older Health Survey figure for the same measure. The guidance says not to present the gap as change over time. Differences in design, method and sampling can mislead.
You may still point out the difference. The guidance allows it if you make clear that the methods differ. Its own worked example says the GSGB estimate 'is higher than estimates produced by other studies which use different methodologies'.
That is the whole of the permitted claim. It does not say harm has risen or fallen. For the two headline rates and the reasons behind the gap, see why Britain has more than one official problem gambling rate.
Sources: Gambling Commission: GSGB guidance.
Can these two figures be compared?
| The pairing | As a trend? | What to do instead | Evidence |
|---|---|---|---|
| GSGB 2023 annual and GSGB 2025 annual | Yes | Same series and method. The trends report does exactly this. | · Gambling Commission: GSGB guidance |
| A GSGB figure and a Health Survey figure | No | State the difference and say the methods differ. | · Gambling Commission: GSGB guidance |
| A GSGB annual figure and one wave | Use the annual | Keep wave data for questions about one period. | · Gambling Commission: GSGB guidance |
| A share of all adults and a share of past-year gamblers | No | Different bases. Label which one each figure uses. | · Gambling Commission: GSGB guidance |
| A 2023 figure as first published and one from 2025 | Check first | Some 2023 and 2024 estimates were later corrected. | · Gambling Commission: GSGB technical report |
Keep this table. It answers most arguments about UK gambling statistics before they start.
The base — 47% of adults, or 27% without lottery-only players
Inside the GSGB itself, one figure can be quoted on several bases. The guidance names three: all participants, people who gambled in the past 12 months, and people who did more than take part in lottery draws.
The third base exists because lotteries are far more popular than any other form of gambling. In 2025, 47% of adults had gambled in the past four weeks. With people who only took part in lottery draws left out, the figure was 27%.
Both numbers are correct. They answer different questions, so name the base every time you quote one.
Sources: Gambling Commission: GSGB guidance; Gambling Commission: GSGB annual report 2025.
One survey, three bases
| Base | Gambled in the past four weeks, 2025 | Evidence |
|---|---|---|
| All adults aged 18 and over | 47% | · Gambling Commission: GSGB annual report 2025 |
| Excluding people who only took part in lottery draws | 27% | · Gambling Commission: GSGB annual report 2025 |
Same survey, same year, same people. Only the base changes.
The range around a figure — 2.4%, or 1.9% to 2.8%
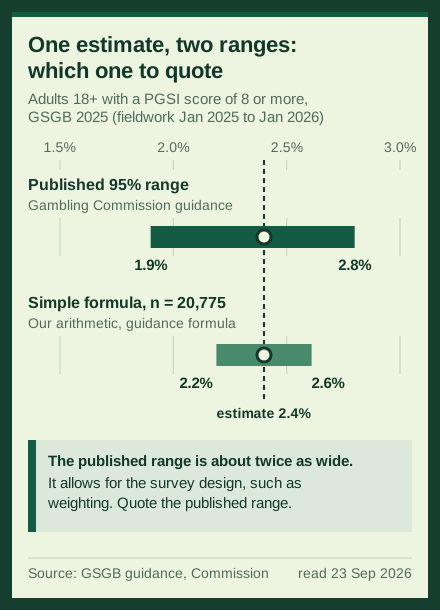
Every GSGB figure is an estimate from a sample, so it has a margin of error. The guidance gives an example. About 2.4% of adults in Great Britain had a PGSI score of 8 or more in 2025, the band UK statistics call problem gambling.
The same example says the true value is likely to fall between 1.9% and 2.8%. The guidance also gives a simple formula for a 95% confidence interval, which the calculator below uses. On 20,775 people it gives a narrower range, about 2.2% to 2.6%.
The published range is wider because the survey's design, such as its weighting, also affects the interval. Use the published range where there is one. When the annual report comments on a difference, it is one the Commission treats as statistically significant.
These are population figures; they say nothing about any one reader. If gambling is causing harm to you or someone near you, GamCare is on 0808 8020 133, free, 24 hours.
Sources: Gambling Commission: GSGB guidance; Gambling Commission: GSGB technical report.
Try the formula: a 95% range around a survey percentage
Enter a published percentage and the number of people it is based on. The tool applies the formula in the GSGB guidance and gives the lower and upper ends of the range.
Worked example: with published percentage 2.4%, number of people in the base 20,775, margin either side is 0.21% and lower end of the range is 2.2% and upper end of the range is 2.6%. The 2025 PGSI 8 or more estimate, 2.4%, on 20,775 people. The published range is 1.9% to 2.8%.
This is the simple formula only. Published GSGB intervals also allow for weighting and design, so they are usually wider. Use the published one where it exists.
How to read the next GSGB release
In a typical year the GSGB publishes four wave releases and one annual report. The steps below turn any of their figures into a sentence you can defend. They add to the wider checklist for reading gambling statistics on this site.
Most misreadings come from the base, not the number. A share of all adults and a share of people who gamble are different claims, which is why the denominator changes the story.
Sources: Gambling Commission: GSGB guidance.
Turn a GSGB figure into a sentence you can defend
Five steps, using only what the Commission publishes. The Commission's own examples follow this pattern.
Name the series and the year
Write the survey and its year label, for example GSGB Year 3, 2025.
Name the base
Say whether the figure is a share of all adults, of people who gambled in the past year, or of people who did more than lottery draws.
The guidance says this is where it has seen misreporting.
Add the fieldwork dates
Year 3 ran from January 2025 to January 2026. Write the dates next to the label.
Add the range
Quote the published confidence interval, or say that none was published for this figure.
What the result means
Compare it only with earlier GSGB years. Against any other survey, state the difference and say the methods differ.
What the statistics cannot tell you
The GSGB is careful work, but it has limits that the Commission sets out itself. The PGSI is not a measure of gambling addiction, and the guidance says not to describe it as one.
Some questions are asked only online, and those figures should be labelled online-only. The questions on wider consequences cover only the past year. They miss harm that carries on after someone has stopped gambling.
Published figures can also move after release. A correction amended some 2023, 2024 and early 2025 estimates. Most moved by between 0.1% and 1%, and the Commission says the overall narrative stayed the same.
The underlying data can be checked independently. Annual datasets go to the UK Data Service, and the technical report says the Year 3 data will be submitted by November 2026.
Sources: Gambling Commission: GSGB guidance; Gambling Commission: GSGB technical report.
Before you quote a GSGB figure
Each line comes from the Commission pages read on 23 September 2026. Ticks stay in your browser and are not sent anywhere.
The guidance says not to describe it as one.
- If I chart the GSGB beside an older survey, I have marked the break in method and explained it beside the chart.
Ticks are kept only in this browser and are never sent anywhere.
Sources checked 23 September 2026
We read every source below on 23 September 2026 and quote them as published. All five statistical sources are Gambling Commission pages. The helpline number was read on the GamCare site on the same day.
The 2.2% to 2.6% range is our own arithmetic, using the formula in the guidance. Nothing on this page was measured by us.
Sources: Gambling Commission: GSGB technical report; Gambling Commission: GSGB guidance; Gambling Commission: GSGB annual report 2025; Gambling Commission: GSGB trends 2023 to 2025; Gambling Commission: GSGB 2023 introduction; GamCare: talk to us now.
Questions answered
How do I interpret UK gambling statistics reports?
Find the survey series and its year label first, then the fieldwork dates, the base and the published range. Compare a Gambling Survey for Great Britain figure only with earlier GSGB years.
Can I compare the GSGB with the Health Survey for England?
Not as a trend. The Commission's guidance says direct comparisons with other gambling or health surveys can mislead. You may point out a difference if you say the methods differ, as the Commission's own example does for the PGSI estimate.
Why does the GSGB have two baselines?
Year 1 covered only July 2023 to February 2024. From 2024 the survey ran on a calendar-year basis, and the guidance measures change against both the 2023 and the 2024 baselines.
Did gambling go up or down between 2023 and 2025?
The Commission's trends report found few differences. Past-four-week participation was 48% in 2023 and 47% in 2025, which it describes as a pattern of stability.
Is the PGSI a measure of gambling addiction?
No. The Commission's guidance says not to describe the PGSI as a measure of gambling addiction. It is a nine-question screen for behavioural symptoms and some adverse consequences.
Data sources
- Gambling Survey for Great Britain technical report: methodology
- Guidance on using statistics from the Gambling Survey for Great Britain
- Gambling Survey for Great Britain (Annual Report 2025): Official statistics
- Gambling Survey for Great Britain (GSGB): Trends report 2023 to 2025
- Gambling Survey for Great Britain annual report (2023): introduction
- Talk to us now
Continue reading
The denominator changes the story
A percentage needs a denominator.
Read The denominator changes the story
The Gambling Commission’s income is not the casino industry’s revenue
A worked reading of the regulator’s 2024–25 accounts separates licence fees, operating income, complaint counts and industry gambling yield.
Read The Gambling Commission’s income is not the casino industry’s revenue
Why two official online gambling GGY tables do not reconcile
The Commission’s market overview and industry statistics count different things. Keep their coverage, periods and bonus treatment attached to the numbers before doing arithmetic.
Read Why two official online gambling GGY tables do not reconcile
Britain has more than one official problem gambling rate
The Gambling Survey for Great Britain puts problem gambling at 2.4%. The Health Survey for England put it at 0.3%. Both are real, both are cited — here is the source register that explains the gap.
Read Britain has more than one official problem gambling rate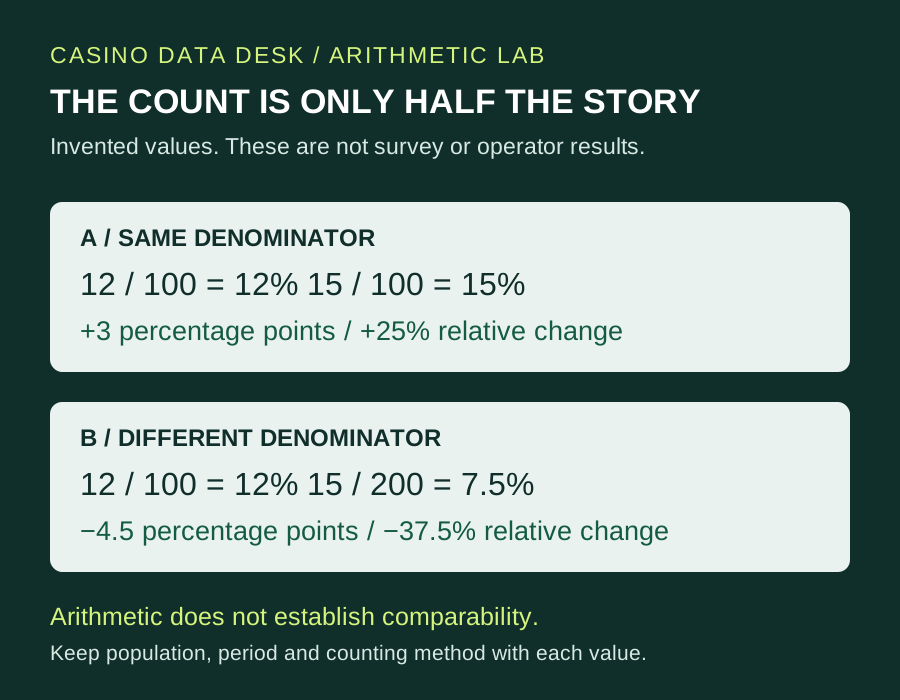
How do you read online casino statistics without misleading yourself?
A practical guide to casino revenue, active accounts and survey estimates, with a dated official-data example and an original percentage comparison tool.
Read How do you read online casino statistics without misleading yourself?
Continue reading
The Gambling Commission’s income is not the casino industry’s revenue
A worked reading of the regulator’s 2024–25 accounts separates licence fees, operating income, complaint counts and industry gambling yield.
Read The Gambling Commission’s income is not the casino industry’s revenueWhy two official online gambling GGY tables do not reconcile
The Commission’s market overview and industry statistics count different things. Keep their coverage, periods and bonus treatment attached to the numbers before doing arithmetic.
Read Why two official online gambling GGY tables do not reconcileThe denominator changes the story
A percentage needs a denominator.
Read The denominator changes the storyPercentage change, with context
The denominator changes the story
Britain has more than one official problem gambling rate
How do you read online casino statistics without misleading yourself?
The Gambling Commission’s income is not the casino industry’s revenue
Why two official online gambling GGY tables do not reconcile