
Report 03 / 04
Core guide · prevalence and method
Britain has more than one official problem gambling rate
The Gambling Commission's 2025 survey put problem gambling at 2.4% of adults. A Department of Health survey four years earlier put the same measure at 0.3%. Neither number is wrong. Here is the source register that explains the gap, and a method for reading the next headline rate without being misled by it.
Start with what "problem gambling rate" is actually asking
"Does the UK have a gambling problem?" is not answerable as asked. It has no defined population, no named survey and no stated threshold. Every published rate behind that headline answers a narrower question: what share of a specific, dated, surveyed population scored at or above a specific point on a specific screening instrument.
UK statistics on this topic almost always use the Problem Gambling Severity Index, or PGSI, a nine-item self-report scale. A respondent's answers are summed to a score from 0 to 27. The conventional UK bands are 0 (non-problem), 1–2 (low risk), 3–7 (moderate risk) and 8 or more (problem gambling). "The problem gambling rate" almost always means the share of a population scoring 8 or more — but which population, surveyed how, and in which year, changes the answer more than most headlines let on.
This article is about two real, cited, official-looking figures for that same 8-or-more threshold that sit roughly eight times apart, and what a careful reader does with that gap instead of picking whichever number suits the story.
The Gambling Survey for Great Britain's headline number
The Gambling Commission's Gambling Survey for Great Britain (GSGB) is the current official measure. Its 2025 annual report, published 16 July 2026, is based on 20,775 adults aged 18 and over living in Great Britain, recruited and surveyed across four quarterly waves running from January 2025 to January 2026. Respondents complete the survey online, unprompted by an interviewer — a "push-to-web" design the Commission adopted after a 2020–21 consultation on replacing its older, more fragmented approach to measuring gambling.
The headline result: 2.4% of participants scored 8 or more on the PGSI, meeting the definition of problem gambling. A further 3.5% scored 3–7 (moderate risk) and 7.8% scored 1–2 (low risk). Put together, just over 13% of GB adults surveyed showed some level of risk on the scale, with 2.4% at the most severe end.
The same 2025 release also reports gambling participation holding broadly flat: 47% of adults reported gambling in the past four weeks, against 48% in the equivalent 2023 wave, which the Commission describes as a stable pattern across most metrics it tracks rather than a meaningful shift.
Sources: Gambling Survey for Great Britain — Annual Report 2025: Official Statistics, UK Gambling Commission, published 16 July 2026; GSGB Trends Report 2023 to 2025.
The Health Survey for England's headline number, for the same threshold
The Health Survey for England (HSE) is a long-running, government-commissioned survey run for the Department of Health and Social Care, published through NHS Digital. Its 2021 wave carried a gambling chapter covering adults aged 16 and over in England, with fieldwork running from January 2021 to March 2022 and the gambling findings published 16 May 2023.
HSE 2021 used the same PGSI instrument, alongside a second screen (DSM-IV), but its respondents were recruited and interviewed as part of a broader household health survey, with the sensitive gambling questions answered in a self-completion booklet handed to the respondent during that interviewer-led visit rather than filled in unprompted online.
Its headline: 0.3% of England adults scored 8 or more on the PGSI — the same "problem gambling" threshold GSGB uses. A further recut using PGSI 1 or more (any level of risk, the widest band) put 2.8% of adults in that broader group. The DSM-IV screen, run in parallel, found 0.4% at its "problem gambling" threshold. The chapter separately flagged that people who had gambled online specifically showed a much higher at-risk-or-problem rate, 18.2%, among that narrower subgroup.
Source: Health Survey for England, 2021 part 2: Gambling, NHS Digital, published 16 May 2023.
Two population surveys, one nearly eightfold gap
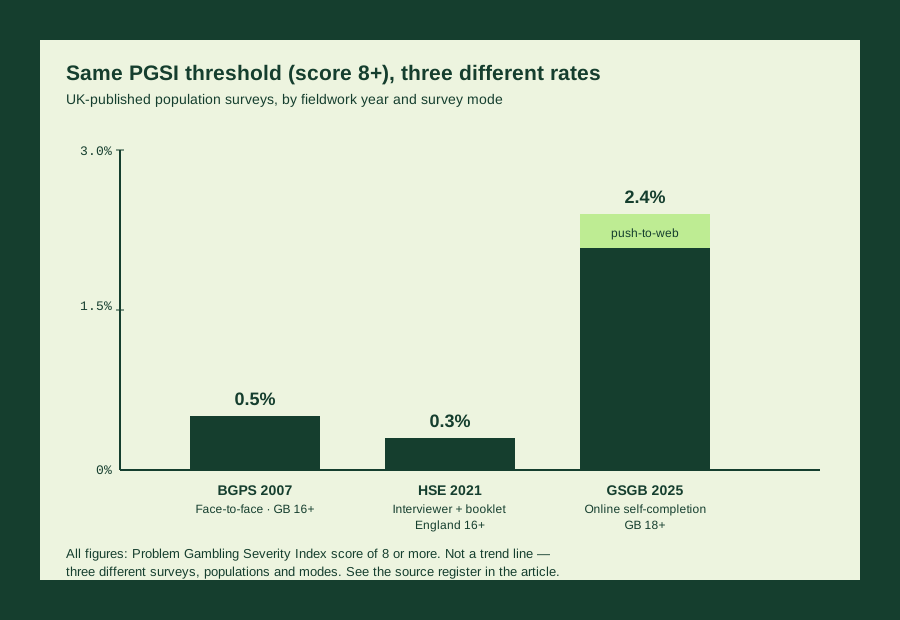
Set the two headline PGSI 8+ figures next to each other: GSGB 2025 reports 2.4% of Great Britain adults; HSE 2021 reports 0.3% of England adults. Both are legitimate, government-linked, methodologically documented surveys. Neither is a leaked estimate or an advocacy-group projection. And they differ by a factor of roughly eight on the exact same scale and the exact same cut-point.
A third data point sharpens this further. The Commission's own predecessor study, the British Gambling Prevalence Survey (BGPS) 2007, surveyed just over 9,000 GB adults aged 16 and over face to face, using a random sample of addresses. Its PGSI-based problem gambling rate was 0.5% — much closer to HSE's 0.3% than to GSGB's 2.4%, despite being 18 years older.
That pattern — two face-to-face-adjacent surveys landing near 0.3–0.5%, and the newer online self-completion survey landing at 2.4% — is the clue to what's actually driving the gap, and it isn't simply "gambling harm has risen." See the figure below for the three rates side by side.
Why survey mode moves the number more than behaviour does
The Gambling Commission's own published guidance on using GSGB statistics addresses this directly. It advises against using GSGB "to provide direct comparisons with results from other gambling or health surveys," because "differences in survey design, methodology, and sampling can lead to misleading comparisons" — while still allowing that highlighting differences is fine, provided the methodology gap is stated rather than implied to be a real-world trend.
The guidance goes further and names the mechanism. Research commissioned by the Commission found that respondents completing a survey online by themselves reported significantly higher PGSI scores than respondents answering the same questions over the phone with an interviewer. The Commission's own reading of that finding is that interviewer-administered surveys under-report gambling harm because of social desirability bias — people soften their answers when another person is asking. Self-completion, whether on paper or online, "largely avoids this measurement bias," in the Commission's phrasing, which is part of why it moved to a push-to-web design for GSGB in the first place.
That single, documented effect is consistent with everything above: BGPS 2007 (face to face) and HSE 2021 (interviewer visit, though with a self-completion booklet for the gambling section specifically) sit close together at 0.3–0.5%; GSGB 2025 (fully online, self-completion, no interviewer present at any stage) sits far higher at 2.4%. None of this proves the true rate is exactly one of these numbers. It shows that a change of measurement method can move a headline statistic by several multiples without any change in the underlying population's gambling behaviour — which is precisely why the Commission warns against drawing a line between old and new figures and calling it a trend.
Source: Guidance on using statistics from the Gambling Survey for Great Britain, UK Gambling Commission.
The source register: every recurring UK survey side by side
A source register keeps a survey's identity attached to its number, so a figure can never be quoted without the conditions that produced it. Here is the register for the three GB/England-wide problem gambling prevalence surveys referenced above.
Table 01 Scroll across to read every column.
| Survey | Publisher | Population | Mode | Sample | Fieldwork | Published | PGSI 8+ rate | Key caveat |
|---|---|---|---|---|---|---|---|---|
| British Gambling Prevalence Survey (BGPS) 2007 | Gambling Commission (bespoke study) | GB adults 16+ | Face-to-face household interview, random address sample | ~9,000 | 2007 | 2008 | 0.5% | Discontinued after a further 2010 wave; superseded by Health Survey modules and later GSGB. |
| Health Survey for England (HSE) 2021, gambling chapter | Department of Health and Social Care / NHS Digital | England adults 16+ | Interviewer-led household visit; self-completion booklet for gambling questions | Not stated in the published chapter | Jan 2021–Mar 2022 | 16 May 2023 | 0.3% (2.8% at PGSI 1+) | England only, not Great Britain; fieldwork spans pandemic-era restrictions on daily life. |
| Gambling Survey for Great Britain (GSGB) 2025, Annual Report | UK Gambling Commission | GB adults 18+ | Push-to-web, online self-completion, four quarterly waves | 20,775 | Jan 2025–Jan 2026 | 16 July 2026 | 2.4% | New methodology from July 2023; publisher advises against direct comparison with the two rows above. |
Read the caveat column before the rate column. It is doing more work than the number.
Sources: British Gambling Prevalence Survey 2007: executive summary; Health Survey for England, 2021 part 2: Gambling; Gambling Survey for Great Britain — Annual Report 2025; GSGB Annual Report 2023: introduction and survey history.
What the financial-harm figures do and do not say about debt
A common follow-up question is the average amount of gambling debt in the UK. No survey in the register above, or any other population-representative UK survey we could locate, publishes that figure. GSGB 2025 does report financial-harm indicators among past-year gamblers: 5.8% said they had used savings or borrowed money to gamble at least occasionally, 6.4% said they had reduced spending on everyday items because of gambling, and 1.7% reported a relationship breakdown linked to gambling — its most commonly reported severe consequence. These are shares of people reporting a behaviour or an outcome, not pound amounts, and not an average of anything.
Numbers that do carry a pound sign and the word "average gambling debt" typically come from debt-advice charities describing their own client caseload — people who have already sought debt help and mentioned gambling as a factor. That is a real and useful figure for understanding who arrives at a debt charity's door, but it is not a random sample of UK adults, or even of UK adults who gamble, and treating a caseload average as the population average repeats exactly the labelling error this site exists to flag.
Sources: GSGB Annual Report 2025: consequences from gambling; StepChange: gambling and problem debt research (client-caseload research, cited here to show the distinction, not as a population estimate).
A prevalence rate is not a participation rate
It is worth separating two figures that get folded into each other in casual reporting. GSGB's 47% past-four-weeks participation rate describes how many GB adults gambled at all, on anything, including the National Lottery. Its 2.4% PGSI 8+ rate describes a share of the same adult population, not a share of the 47% who actually gambled — the Commission's release does not, in the same document, restate 2.4% as a rate among gamblers only, and doing that recalculation yourself would need the actual gambler denominator, not the whole-adult one.
This is the same denominator discipline this site sets out in The denominator changes the story: a percentage is only informative once you know what it is a percentage of. "2.4% of adults" and "2.4% of gamblers" are different claims, and only the first is what GSGB 2025 actually reports.
A repeatable method for reading the next headline rate
Before repeating a problem gambling statistic, check five things and write them down next to the number: which survey it comes from; which population it covers (age range and geography); which year the fieldwork happened; whether it was collected online, by phone, or face to face; and which PGSI (or other) threshold is being quoted. If a headline compares two years without naming the survey behind each one, treat the comparison as unverified until you can check — this is exactly the situation covered in A new survey can create a new baseline, and GSGB's 2023 changeover is close to a textbook case of it.
None of this is a reason to distrust the numbers. GSGB 2025 and HSE 2021 are both careful, documented, publicly available pieces of work, and the Commission's own guidance is unusually candid about the limits of comparing across them. The discipline is simply to keep each figure's conditions attached to it, rather than letting "the problem gambling rate" collapse into a single, unqualified number that no cited source actually states.
Data sources
- Gambling Survey for Great Britain — Annual Report 2025: Official Statistics, UK Gambling Commission, published 16 July 2026. Retrieved 19 September 2026.
- GSGB Annual Report 2025: consequences from gambling, UK Gambling Commission. Retrieved 19 September 2026.
- Gambling Survey for Great Britain: Trends report 2023 to 2025, UK Gambling Commission, published 16 July 2026. Retrieved 19 September 2026.
- Guidance on using statistics from the Gambling Survey for Great Britain, UK Gambling Commission. Retrieved 19 September 2026.
- Gambling Survey for Great Britain — Annual Report 2023: introduction and survey history, UK Gambling Commission. Retrieved 19 September 2026.
- Health Survey for England, 2021 part 2: Gambling, NHS Digital, published 16 May 2023. Retrieved 19 September 2026.
- British Gambling Prevalence Survey 2007: executive summary, Gambling Commission / National Centre for Social Research, published July 2008. Retrieved 19 September 2026.
- Gambling and problem debt research, StepChange Debt Charity. Cited to show the distinction between charity caseload data and population survey data. Retrieved 19 September 2026.