Core guide
How do you read online casino statistics without misleading yourself?
A practical guide to casino revenue, active accounts and survey estimates, with a dated official-data example and an original percentage comparison tool.
First decide what your casino question actually measures
How many people use online casinos, how much operators generate and how often an account is active are three different questions. A search for UK casino statistics can return all three on the same results page. Choosing the biggest or newest number does not make it the answer to your question.
Start by writing the sentence you want to establish before finding a number. “How many adults reported this activity?” needs a defined population and a participation measure. “What happened to online slots revenue?” needs a financial series. “How frequently was this account used?” needs a defined account-activity record. Keep those sentences separate in your notes.
This guide builds on The denominator changes the story and A new survey can create a new baseline. It brings the two reading skills together around a documented online-slots example, a source-selection method and a calculator you can use without supplying account information.
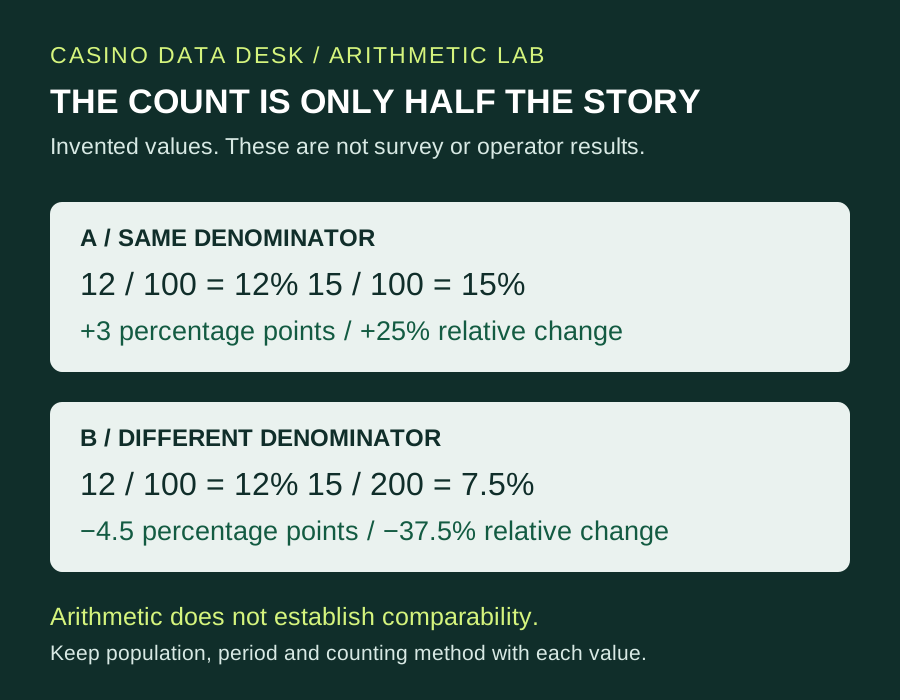
The main market example is historical: January to March 2026. It is included because its explicit counting limits make a useful case study, not because a closed series can stand in for every later market release. The examples in the green diagram and calculator are entirely invented.
Read this real online-slots figure with its full label
The Gambling Commission’s final Market Impact release reports £773 million of online slots Gross Gambling Yield, or GGY, for January–March 2026. It reports 4.8 million average monthly active slots accounts in the same release. Coverage is the largest participating online operators; these are not stated as complete-market totals or unique people. The dataset may include free bets and bonuses, and the release warns against comparison with Industry Statistics.
Write a research note with four separate fields: “£773 million”; “online slots GGY”; “January–March 2026”; “Market Impact, largest participating operators”. Each field stops a different error. Omitting the product broadens slots into all casino games. Omitting the period makes a quarter sound annual. Omitting the coverage turns a limited dataset into the whole market.
The £773 million figure cannot establish that a named brand such as bet365 Casino, William Hill Casino or 888casino grew by a particular amount. Those names are examples of branded research questions, not brands separately measured in this guide. A brand-level claim would need evidence that identifies the relevant brand, business, territory and measure.
Do not turn GGY into deposits or company profit
The Commission’s Industry Statistics glossary defines GGY using stakes and other directly related amounts accruing to the licensee, less prizes or winnings. That definition is more specific than money deposited, and it is not an after-expenses company-profit figure. The applicable dataset’s own accounting notes still govern a quoted statistic.
An invented cash-only illustration makes the distinction visible. Suppose an account receives a £20 deposit. It stakes £5, receives a £4 return, then stakes that £4 and receives nothing. The deposit remains £20, total stakes are £9 and total returns are £4. In this simplified example, stakes minus returns is £5. Three different amounts can describe the same sequence without contradicting each other.
Do not extend that small illustration into an operator’s complete reporting calculation. Real records can contain other transactions and definitions. Its purpose is to show why repeatedly staking returned money makes total stakes different from money paid into the account. An article labelled “casino spending” must say which quantity it actually uses.
Count the account, the month and the person separately
A customer account is an operator’s record of a customer. The Industry Statistics glossary counts active remote accounts used for gambling within a reporting period and excludes dormant or suspended accounts. That definition does not make a portfolio of accounts a deduplicated population register.
Imagine one adult with an account at two different casino businesses. An account count can include two records while a person count includes one individual. Imagine the same account appearing in January and February. Adding monthly counts can then count activity in two months rather than establish two different people. These are invented examples of why a unit matters.
The legacy release also warns about repeated counting across product categories and reporting periods. Resist dividing a quarterly money total by a monthly account statistic and calling the result average loss per person. The resulting quotient would mix different units and could hide overlapping accounts, different coverage and a mismatched period. A calculator can perform that division perfectly while the label remains wrong.
Sources: Industry Statistics definitions: accounts and GGY; Final Market Impact release: January–March 2026.
Choose survey evidence for a population question
The GSGB technical report describes a sample intended to represent adults aged 18 and over living in private households in Great Britain. Results are estimates with uncertainty, and the report documents coverage and selection limitations. A page about UK online casinos should preserve that actual territory and population instead of silently broadening it to every UK resident.
The current reporting guidance permits appropriately explained estimates expressed as population counts. It does not retain the earlier blanket warning against doing so. It also distinguishes a within-GSGB trend from a difference between surveys using other methods, and recommends annual findings as the default where suitable.
For an online-casino question, locate the actual activity row. An all-gambling total is not an online-casino participation estimate. Copy the reference period and the table’s base with the result. If the desired subgroup is unavailable, keep that gap visible rather than create it by subtracting unrelated published percentages.
Take care with the word online as well. An online survey response describes how the questionnaire was answered; an online gambling activity describes what the respondent did. The presence of online in a footnote does not automatically identify an online-casino subgroup.
Sources: GSGB technical report: analysis and limitations; GSGB reporting guidance, updated July 2026.
Try the denominator experiment before writing a growth claim
The diagram begins with an invented observation of 12 counted cases out of 100, or 12%. If a comparable later observation is 15 out of 100, the percentage rises to 15%. Subtracting the rates gives an increase of 3 percentage points. Dividing that increase by the original 12% gives 25% relative growth.
Now keep the later count at 15 but change its denominator to 200. The later percentage is 7.5%, which is below 12%. The count increased while the share decreased. The percentage-point difference is minus 4.5; the relative change is minus 37.5%. A headline saying only “cases increased” leaves this second story out.
The workbench lets you change both pairs. Counts must be whole numbers, a subset cannot exceed its denominator and the denominators cannot be zero. If observation A has a zero percentage, the tool leaves relative change undefined. It can still show the percentage-point difference.
Use it for arithmetic learning or clearly defined count records. It does not reconstruct a weighted survey estimate from raw respondent counts, test statistical significance or confirm that two observations share a meaningful definition. Rounding is for display; a printed zero at four decimal places can hide a very small non-zero value.
Enter two counted subsets and their denominators to compare percentages, percentage points and relative change.
Keep uncertainty and method changes out of a false trend
The technical report discusses uncertainty alongside limitations in whom a household survey reaches and who takes part. A narrow confidence interval does not resolve every coverage or selection issue. Use the relevant published interval and interpretation; adding decimal places to an estimate does not supply missing precision.
For an original chart, give every series a visible name and method note. If you have two observations obtained differently, draw separate panels before deciding whether a joined line is justified. A line visually tells a continuity story even when a footnote quietly says the data changed.
Consider an invented operator panel that adds five businesses between two quarters. A larger combined revenue total could partly reflect the added businesses. That does not prove existing businesses grew. Alternatively, a stable panel could alter its definition of a session. A change in the count would then need interpretation against the revised rule.
Record the unresolved comparison question next to the figures: same businesses, same unit, same period length, same geography and same method? This turns an attractive chart into a checkable claim. If a component is unknown, describe the observations separately until the comparison can be established.
Follow the publication series when checking for an update
The Commission’s 21 May 2026 closure announcement says Market Impact ends with the release covering January–March 2026. It points readers towards Industry Statistics, published quarterly from February 2026, for subsequent market information. A monitoring process should therefore stop expecting another release in the closed series.
Keep the old record with its own name and coverage. Start a separate record for a new publication series, then read its definitions before any cross-series analysis. An update is more than replacing the date and largest number in an existing paragraph.
Our practical source card has a release address, publication date, measurement period, geography, product, unit, denominator or coverage, and a short note about revisions. A separate claim field holds the sentence that the evidence supports. That makes later corrections traceable without presenting an altered record as the original publication.
Before quoting a statistic elsewhere, read that claim field aloud. It should still identify what was measured and what was not established. A well-supported casino data article can answer a narrow question precisely, including showing why a broader brand, player-count or market-growth claim remains unanswered.
Sources: Market Impact closure and the future publication series.
Questions answered
Are active casino accounts the same as the number of people playing?
No. One person can hold more than one account, and figures can count different activity periods or products. A person count needs an appropriate method of identifying unique individuals.
Is a move from 12% to 15% an increase of 3%?
It is an increase of 3 percentage points. Relative to the starting 12%, the increase is 25%. Say which calculation you mean.
Can a general gambling participation figure describe online casino players?
Only if the actual measure and subgroup identify online casino participation. An all-gambling result cannot simply be relabelled.
Does the calculator prove a casino statistic changed significantly?
No. It checks arithmetic for two count-and-denominator pairs. Comparability, survey weighting and statistical significance require additional information and methods.