The Gambling Survey for Great Britain puts problem gambling at 2.4%. The Health Survey for England put it at 0.3%. Both are real, both are cited — here is the source register that explains the gap.
A practical guide to casino revenue, active accounts and survey estimates, with a dated official-data example and an original percentage comparison tool.
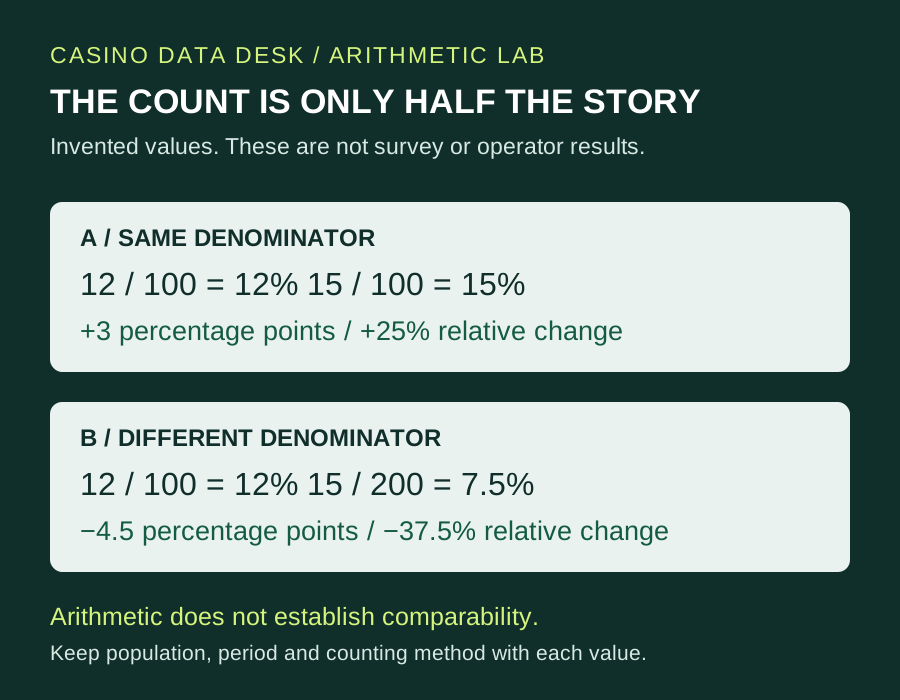
The Commission’s market overview and industry statistics count different things. Keep their coverage, periods and bonus treatment attached to the numbers before doing arithmetic.
To interpret a UK gambling statistics report, find the survey series and year first. The Gambling Survey for Great Britain began a new baseline in 2023, so its figures compare only with earlier GSGB years.
Why do two official figures for the same thing disagree?
First check whether they are actually the same measure. Here licence-fee income and total operating income differ because the latter includes other income.
The Commission’s returns guidance uses stakes and other relevant accruing amounts less prizes or winnings, under its specified rules. It is distinct from the regulator’s own fee income.
The regulator’s annual accounts cannot answer that prevalence question. It needs population research with definitions and methods attached, rather than a fee or complaint total.